
Champions League Betting Odds Explained: Read, Compare & Find Value
 Available in US
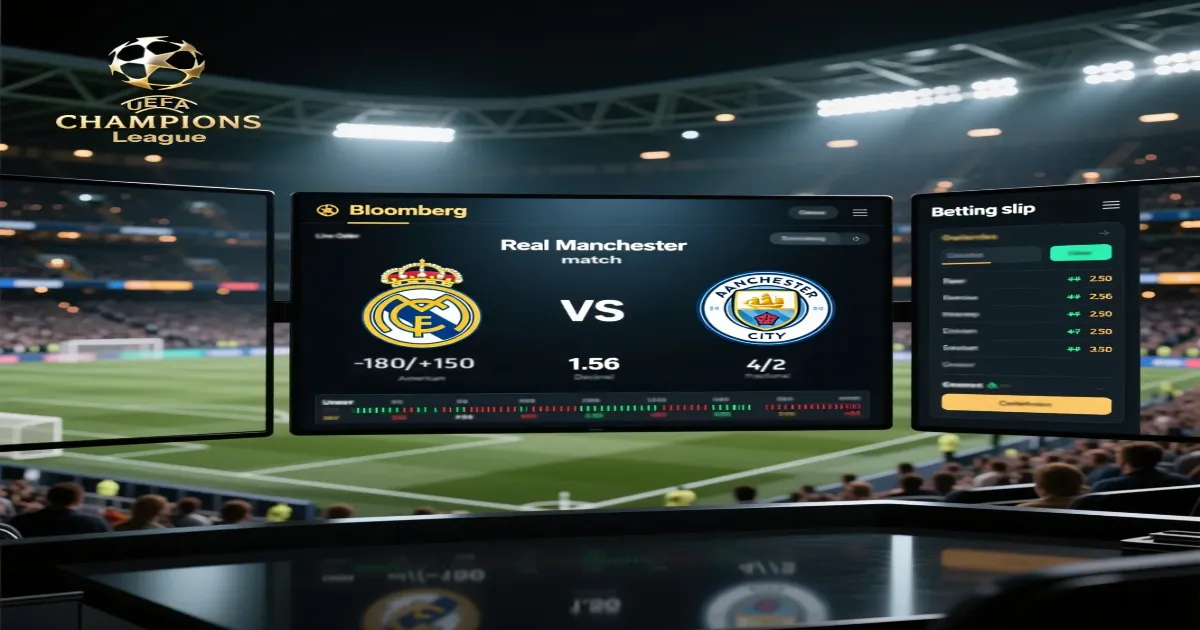
The first time I looked at Champions League betting odds, I thought I understood them. Liverpool at -180 to beat Napoli seemed straightforward enough—they’re the favorite, so I bet them, right? Then I watched as those odds shifted to -220 by kickoff, realized I’d left money on the table, and Liverpool proceeded to draw one-one anyway. That expensive lesson taught me that understanding odds isn’t just about knowing who’s favored. It’s about reading the language bookmakers use to communicate probability, value, and market sentiment.
Champions League odds tell a story if you know how to listen. They reveal which teams sharp bettors are backing, where the public is overreacting to recent results, and most importantly, where genuine value hides in plain sight. The difference between a recreational bettor and someone who consistently wins money often comes down to odds literacy—understanding not just what the numbers mean, but why they’re set that way and how to exploit discrepancies.
Here’s what makes Champions League odds particularly fascinating: they exist in a weird space between domestic league betting and major tournaments. You’ve got months of form data to analyze like league betting, but the psychological pressure and tactical adjustments mirror World Cup knockout matches. Bookmakers need to account for European pedigree, home advantage that varies wildly between venues, and squad rotation patterns that can turn a favorite into a risky proposition overnight.
This guide breaks down everything you need to know about Champions League odds—from basic probability calculations to identifying line movements that signal sharp money, to understanding why the odds on a Bayern Munich match look completely different from a Premier League fixture despite similar team quality. Whether you’re trying to figure out why Real Madrid is +200 in one market and 3.00 in another, or you want to understand how to compare odds across different sportsbooks to find the best value, we’re covering all of it without the usual betting guide nonsense that assumes you already know what you’re doing.
The Anatomy of Champions League Odds
What Odds Actually Represent
Odds are probability dressed up in numbers that bookmakers use to balance their books and generate profit. When you see Manchester City listed at -150 to beat RB Leipzig, that number represents two things simultaneously: the bookmaker’s assessment of how likely City is to win, and the price you pay for that prediction.
The crucial insight most bettors miss is that odds aren’t pure probability calculations. They’re the bookmaker’s best guess at probability, adjusted for their risk management needs and expected betting patterns. If bookmakers know the public loves betting favorites, they’ll shade odds on favorites slightly worse than true probability suggests. This creates a margin where informed bettors can find value if they’re willing to back less popular sides.
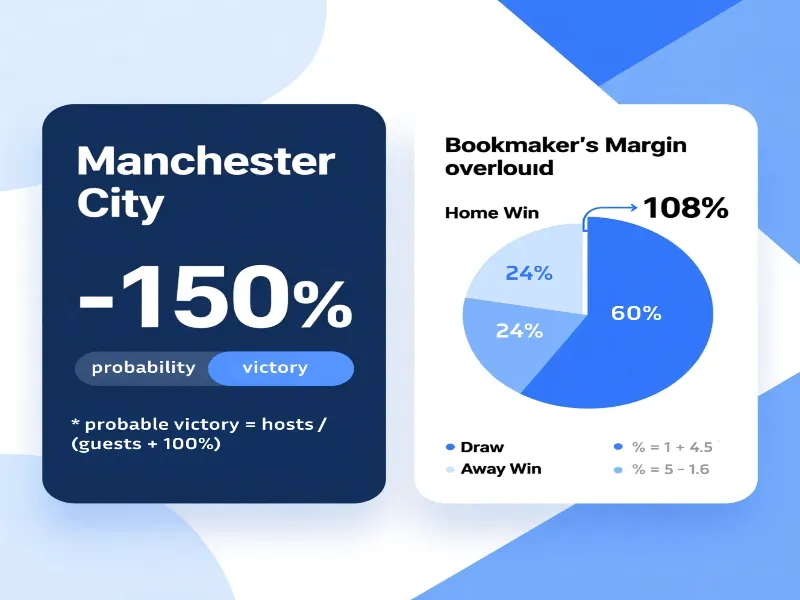
Converting odds to implied probability shows you what the bookmaker thinks should happen. Take those -150 odds on Manchester City. Convert them using the formula for negative American odds: divide the negative number by itself plus 100, then multiply by 100 to get the percentage. So 150 divided by 250 equals 0.60, which means the bookmaker is saying City has a sixty percent chance of winning this match.
But here’s where it gets interesting. If you add up the implied probabilities for all possible outcomes—home win, draw, away win—the total exceeds one hundred percent. That excess is the bookmaker’s margin, often called the overround or vig. A typical Champions League match might show implied probabilities totaling 105 to 108 percent. That extra five to eight percent is the house edge, the mathematical advantage ensuring bookmakers profit regardless of outcomes if betting volume balances.
Understanding this margin changes how you evaluate odds. When you see Real Madrid at -180 against a mid-table opponent, your question shouldn’t be “will Madrid win” but rather “does Madrid win more than the sixty-four percent implied by these odds, accounting for the bookmaker’s margin?” If your analysis suggests Madrid wins seventy percent of the time, you’ve found value even though you’re backing a heavy favorite.
How Sportsbooks Set Champions League Lines
Bookmakers employ sophisticated models combining historical data, team ratings, home advantage factors, and injury information to generate opening lines. These aren’t arbitrary numbers pulled from thin air—they’re the output of algorithms that have processed thousands of matches to identify patterns and predictive factors.
The opening line is just a starting point. Once the line goes live, bookmakers monitor betting action closely. If they’re taking heavy action on one side, they adjust odds to encourage bets on the other side, balancing their exposure. This isn’t because bookmakers want equal action on both sides as a moral principle. It’s pure risk management. Unbalanced books expose them to potential losses if the heavily bet side wins.
Champions League lines typically appear two to three days before matches, earlier than most domestic league games. This timing reflects the tournament’s prestige and betting interest—people want to bet these matches early, so bookmakers accommodate that demand. But early lines also present opportunities because the opening number might not reflect late-breaking information about lineups, tactics, or motivation.
Sharp bettors exploit this window. They bet immediately when they identify value in opening lines, before the broader market weighs in and moves prices. By the time casual bettors wake up on match day and start placing wagers, sharp money has already grabbed the best odds and the lines have shifted. This creates a distinction between getting -180 on Tuesday afternoon versus -220 on Wednesday morning for the exact same match.
Different bookmakers set different lines based on their clientele and risk tolerance. A book catering to European bettors might shade lines differently than one serving Asian markets because betting patterns vary across regions. This creates line shopping opportunities where the same bet offers better value at one book versus another.
Champions League Odds Formats Deep Dive
American Odds Explained
American odds look confusing until you understand the logic, then they’re actually quite intuitive for calculating potential profits quickly. The format uses positive and negative numbers to distinguish favorites from underdogs, with the numbers telling you how much you need to risk or how much you stand to win based on a hundred-dollar stake.
Negative numbers indicate favorites and show how much you need to bet to win one hundred dollars. Liverpool at -180 means you risk one hundred eighty dollars to win one hundred dollars. The calculation for total return is simple: divide your stake by the odds number, multiply by one hundred, then add your original stake back. Bet one hundred eighty dollars at -180, win one hundred dollars profit, get two hundred eighty dollars total back.
Positive numbers indicate underdogs and show how much profit you win from a one hundred dollar bet. Napoli at +220 means a one hundred dollar bet wins two hundred twenty dollars profit. Total return is three hundred twenty dollars—your one hundred dollar stake plus two hundred twenty dollars profit. The bigger the positive number, the less likely the bookmaker thinks that outcome will happen.
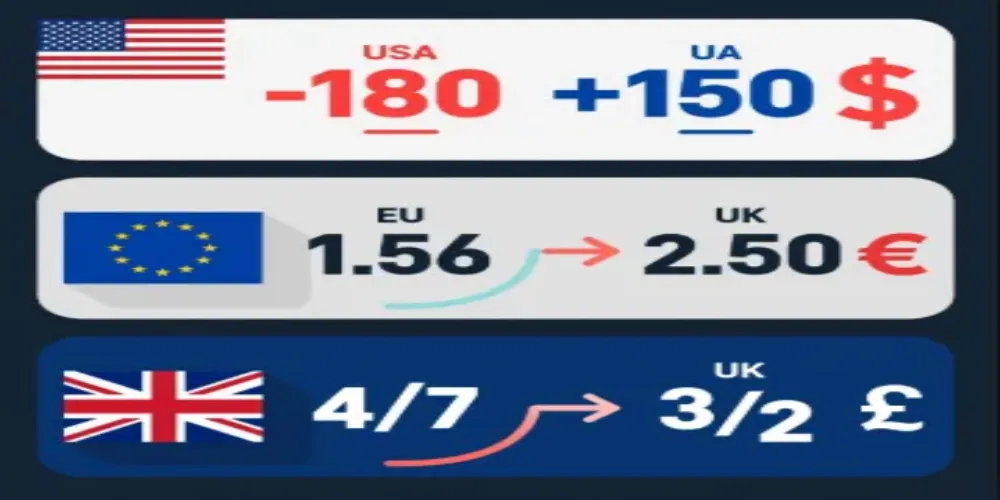
Converting between American odds and probability requires different formulas for favorites versus underdogs. For favorites (negative odds), divide the negative number by itself plus 100. For -180, that’s 180 divided by 280, which equals 64.3 percent implied probability. For underdogs (positive odds), divide 100 by the positive number plus 100. For +220, that’s 100 divided by 320, which equals 31.25 percent implied probability.
The sweet spot in American odds sits around -110 to -120, which represents roughly even money accounting for the bookmaker’s margin. You see these odds frequently on spread bets and totals where bookmakers have set a line they believe splits opinion evenly. Anything significantly different from this range indicates one side is expected to be more popular than the other.
Decimal Odds Explained
Decimal odds dominate European and Asian betting markets because they’re mathematically straightforward and eliminate the favorite-underdog distinction. The decimal number represents your total return per unit wagered, including your original stake. Manchester City at 1.56 means betting one dollar returns 1.56 dollars total—your one dollar stake plus 0.56 dollars profit.
Calculating returns with decimal odds is ridiculously simple: multiply your stake by the decimal number. Bet fifty dollars at 2.50, you get one hundred twenty-five dollars back. No complex formulas, no adjusting for positive versus negative numbers, just straightforward multiplication. This simplicity makes decimal odds perfect for quick mental math when comparing multiple bets or calculating accumulator returns.
Converting decimal odds to implied probability is equally straightforward: divide 1 by the decimal odds, multiply by 100. Real Madrid at 1.62 converts to 61.7 percent implied probability (1 divided by 1.62 equals 0.617). Lower decimal numbers mean higher probability and less potential profit. Decimal odds of 1.01 represent near certainty, while 10.00 or higher suggests a longshot.
The relationship between decimal and American odds follows predictable patterns. Decimal odds above 2.00 convert to positive American odds (underdogs), while decimal odds below 2.00 convert to negative American odds (favorites). Exactly 2.00 decimal odds equals +100 American odds—even money where you double your stake if you win.
Bookmakers often display decimal odds to two decimal places, but that precision matters when comparing lines. The difference between 1.90 and 1.91 might seem negligible, but over hundreds of bets, those small edges compound into meaningful profit or loss. Treat each 0.01 difference as meaningful when line shopping.
Fractional Odds Explained
Fractional odds remain popular in British betting markets despite being less intuitive for quick calculations. The fraction represents profit relative to stake—4/7 means betting seven units wins four units profit. You always get your stake back in addition to the profit, so a seven-unit bet at 4/7 returns eleven units total.
Reading fractional odds requires thinking in ratios. 3/2 means three units profit for every two units staked. Bet twenty dollars at 3/2, you win thirty dollars profit for a total return of fifty dollars. The numerator (top number) shows potential profit, the denominator (bottom number) shows required stake. Larger numerators relative to denominators indicate underdogs.
Converting fractional odds to decimal is straightforward: divide the numerator by the denominator, then add 1. Fractional odds of 3/2 becomes 1.5 plus 1, which equals 2.50 decimal odds. The added 1 accounts for returning your original stake, which decimal odds include automatically but fractional odds express separately.
Odds-on favorites appear with larger denominators than numerators—4/7, 1/2, 2/5. These bets require risking more than you stand to win, reflecting high probability outcomes. Evens or 1/1 means equal stake and profit, equivalent to 2.00 decimal or +100 American. Odds-against appear with larger numerators—3/2, 2/1, 5/1—indicating underdogs where potential profit exceeds stake.
The quirk of fractional odds is how they’re typically quoted. You’ll rarely see 15/10 even though it’s mathematically correct—bookmakers simplify it to 3/2 for readability. Similarly, 10/11 is more common than 100/110 despite representing identical value. This convention makes odds easier to parse at a glance but requires understanding the simplified ratios.
How Champions League Odds Move
Line movement reveals the invisible forces shaping betting markets—sharp money, public bias, breaking news, and bookmaker risk management all leave fingerprints in odds changes. Learning to read these movements gives you an edge because you’re seeing what others bet before the market settles on consensus pricing.
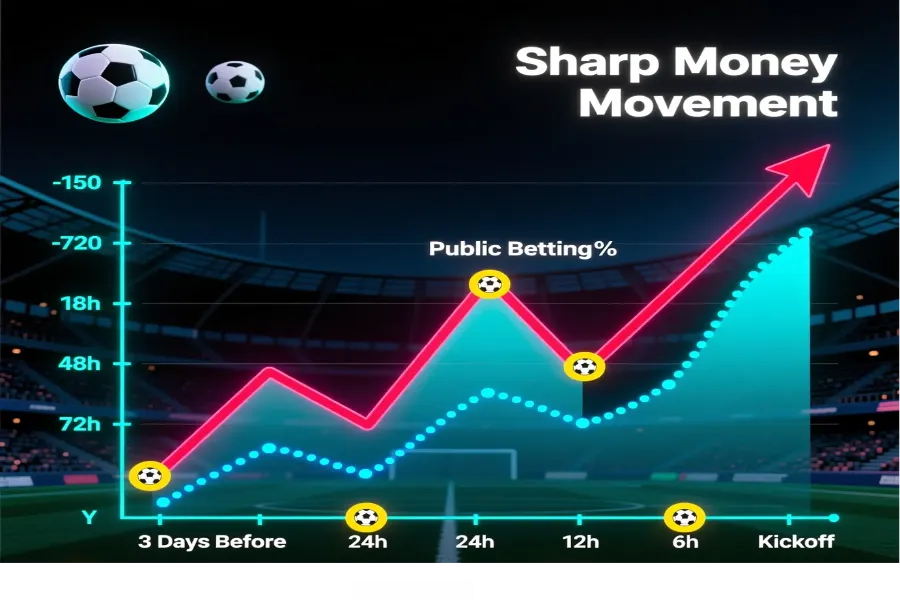
Sharp money refers to bets from professional bettors and syndicates with proven track records of winning. When sharp money hits a line, bookmakers respect it because these bettors win long-term and their opinions carry weight. If Paris Saint-Germain opens at -180 and moves to -220 within hours of lines posting, sharp money likely hammered PSG because informed bettors identified value.
The telltale sign of sharp money is line movement opposite to betting percentages. If eighty percent of bets are on Team A but the odds are moving toward Team B, sharp bettors are backing Team B with large enough stakes to offset the volume of smaller public bets on Team A. Bookmakers would rather balance their exposure than get destroyed by sharp action on one side.
Public money behaves predictably. Recreational bettors love favorites, overs, and home teams. They bet based on emotion, recent results, and name recognition rather than disciplined analysis. This creates betting patterns bookmakers anticipate and price into their opening lines. When the public behaves as expected, lines stay stable or move slightly. When they overreact to news, opportunities emerge.
Injury news moves Champions League odds violently because star players matter more at this level. If news breaks that Manchester City’s striker is out, odds shift immediately as bookmakers adjust for the loss. Smart bettors monitor injury reports obsessively, trying to bet before odds adjust. The window is narrow—minutes sometimes—but catching a line before it moves can add significant value.
Lineup confirmations an hour before kickoff create another wave of movement. Teams sometimes rest key players unexpectedly, particularly in league phase matches when qualification is secure. If Liverpool announces a heavily rotated lineup ninety minutes before kickoff, odds on their opponent improve dramatically. Bettors who waited to confirm lineups gain this intelligence, but they also paid worse odds than early bettors who accepted rotation risk for better prices.
Weather impacts odds for matches played in extreme conditions. Heavy rain, snow, or oppressive heat change how matches unfold, typically favoring under bets and defensive styles. Bookmakers adjust totals downward when forecasts show difficult conditions, but sometimes they underreact if they’re worried about overcompensating.
Finding Value in Champions League Odds
Value exists when your assessment of probability exceeds the probability implied by the odds. If you believe Arsenal has a fifty-five percent chance of winning but the odds imply only forty-eight percent, that seven-percent edge represents value. Finding these discrepancies consistently separates winners from losers.

The challenge is honestly assessing probability without bias. Most bettors overestimate their team’s chances, underestimate opponents they don’t respect, and fail to account for variance. Keeping a betting journal forces intellectual honesty—you track your predicted probability, the odds you got, and actual results. Over time, patterns emerge showing where your calibration is accurate and where you’re consistently wrong.
Line shopping between multiple sportsbooks is the simplest way to find value without changing your handicapping. Different books set different odds based on their client base and risk tolerance. One book offers Real Madrid at -160 while another has them at -180. Taking -160 gives you immediate value without any additional analysis required. These differences compound dramatically over hundreds of bets.
Comparing closing line value measures whether you beat the market. If you bet Liverpool at -140 on Tuesday and the closing line at kickoff is -175, you captured thirty-five cents of value. Consistently beating closing lines is the clearest indicator your analysis is sharp. Track this metric religiously because it’s more predictive of long-term success than win-loss records over small samples.
Exploiting public bias creates value opportunities when recreational bettors overreact to narratives. A team loses badly and suddenly they’re being written off despite underlying metrics suggesting they played well but got unlucky. The public hammers their opponent in the next match, creating value on the previously losing team whose odds are worse than deserved.
Bookmakers aren’t perfect. They make mistakes, particularly in early lines or markets with less liquidity. Finding these errors requires deep knowledge of teams and situations they might have mispriced. Maybe they didn’t account for a key player returning from injury, or they overvalued a team’s recent form against weak opposition. These windows are narrow but exist if you’re watching closely.
Historical Champions League Odds Patterns
Champions League odds follow patterns that persist across seasons because the tournament structure and tactical approaches remain consistent. Understanding these patterns helps you identify situations where current odds diverge from historical norms, signaling potential value.
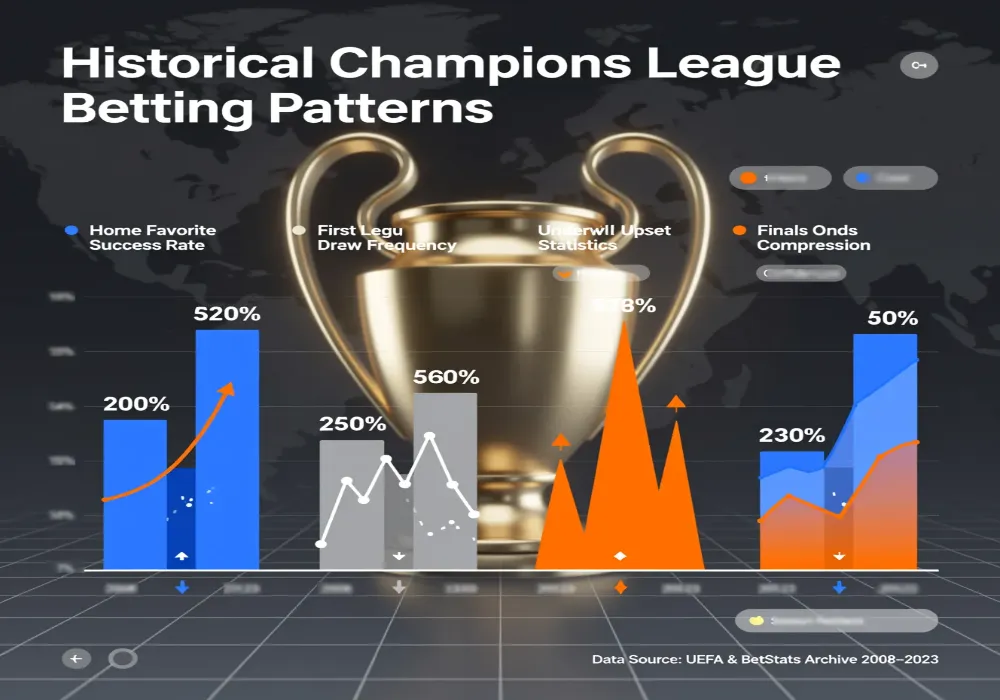
Home favorites in league phase matches typically range from -150 to -250 depending on opponent strength. Bookmakers respect home advantage in European competition more than domestic leagues because the atmosphere and travel burden amplify home field edge. When you see a quality home team priced worse than -300, that extreme favoritism usually means the opponent is genuinely overmatched.
First leg knockout odds skew toward draws more than you’d expect. Bookmakers know teams approach first legs conservatively, prioritizing avoiding defeat over securing victory. Draw odds typically range from +220 to +270 even in matches between unequal opponents because both teams have tactical incentives to keep the tie alive for the second leg.
Underdog success rates in Champions League knockout stages exceed what the odds suggest over large samples. Heavy underdogs at +400 or longer occasionally pull upsets because single-elimination pressure creates chaos. This doesn’t mean blindly backing underdogs profits long-term, but it suggests that when your analysis identifies a genuinely dangerous underdog, the odds often undervalue their actual chances.
Finals odds compress dramatically compared to earlier rounds. The quality gap between finalists is minimal—they both survived the entire tournament—so moneyline odds rarely exceed +150 for either side. The draw becomes the most likely outcome in regular time, creating situations where both teams are technically underdogs to avoid stalemate.
Conclusion
Understanding Champions League odds transforms betting from guesswork into informed decision-making. The numbers communicate probability, value, and market sentiment if you know how to interpret them. Different odds formats serve different purposes—American odds show favorite-underdog relationships clearly, decimal odds simplify return calculations, fractional odds express pure value ratios.
Reading line movements reveals sharp money, public bias, and breaking news impact. Value exists in discrepancies between your probability assessment and implied odds probability, but only if you’re honest about your handicapping accuracy. Line shopping, tracking closing line value, and exploiting public overreactions create edges without requiring supernatural prediction abilities.
Champions League betting rewards patience and discipline. The odds are sophisticated products of complex algorithms and human expertise. You’re not smarter than the market, but you can find specific situations where your knowledge provides an edge. Those situations are rare and fleeting, requiring constant work to identify and act upon before they disappear. Start by mastering odds interpretation, then build from there.
To understand more about the knockout stages, refer to our article on Knockout Stage Betting.
For further insights, visit champions-league-bet.com.
