
Corners & Cards Betting
 Available in US
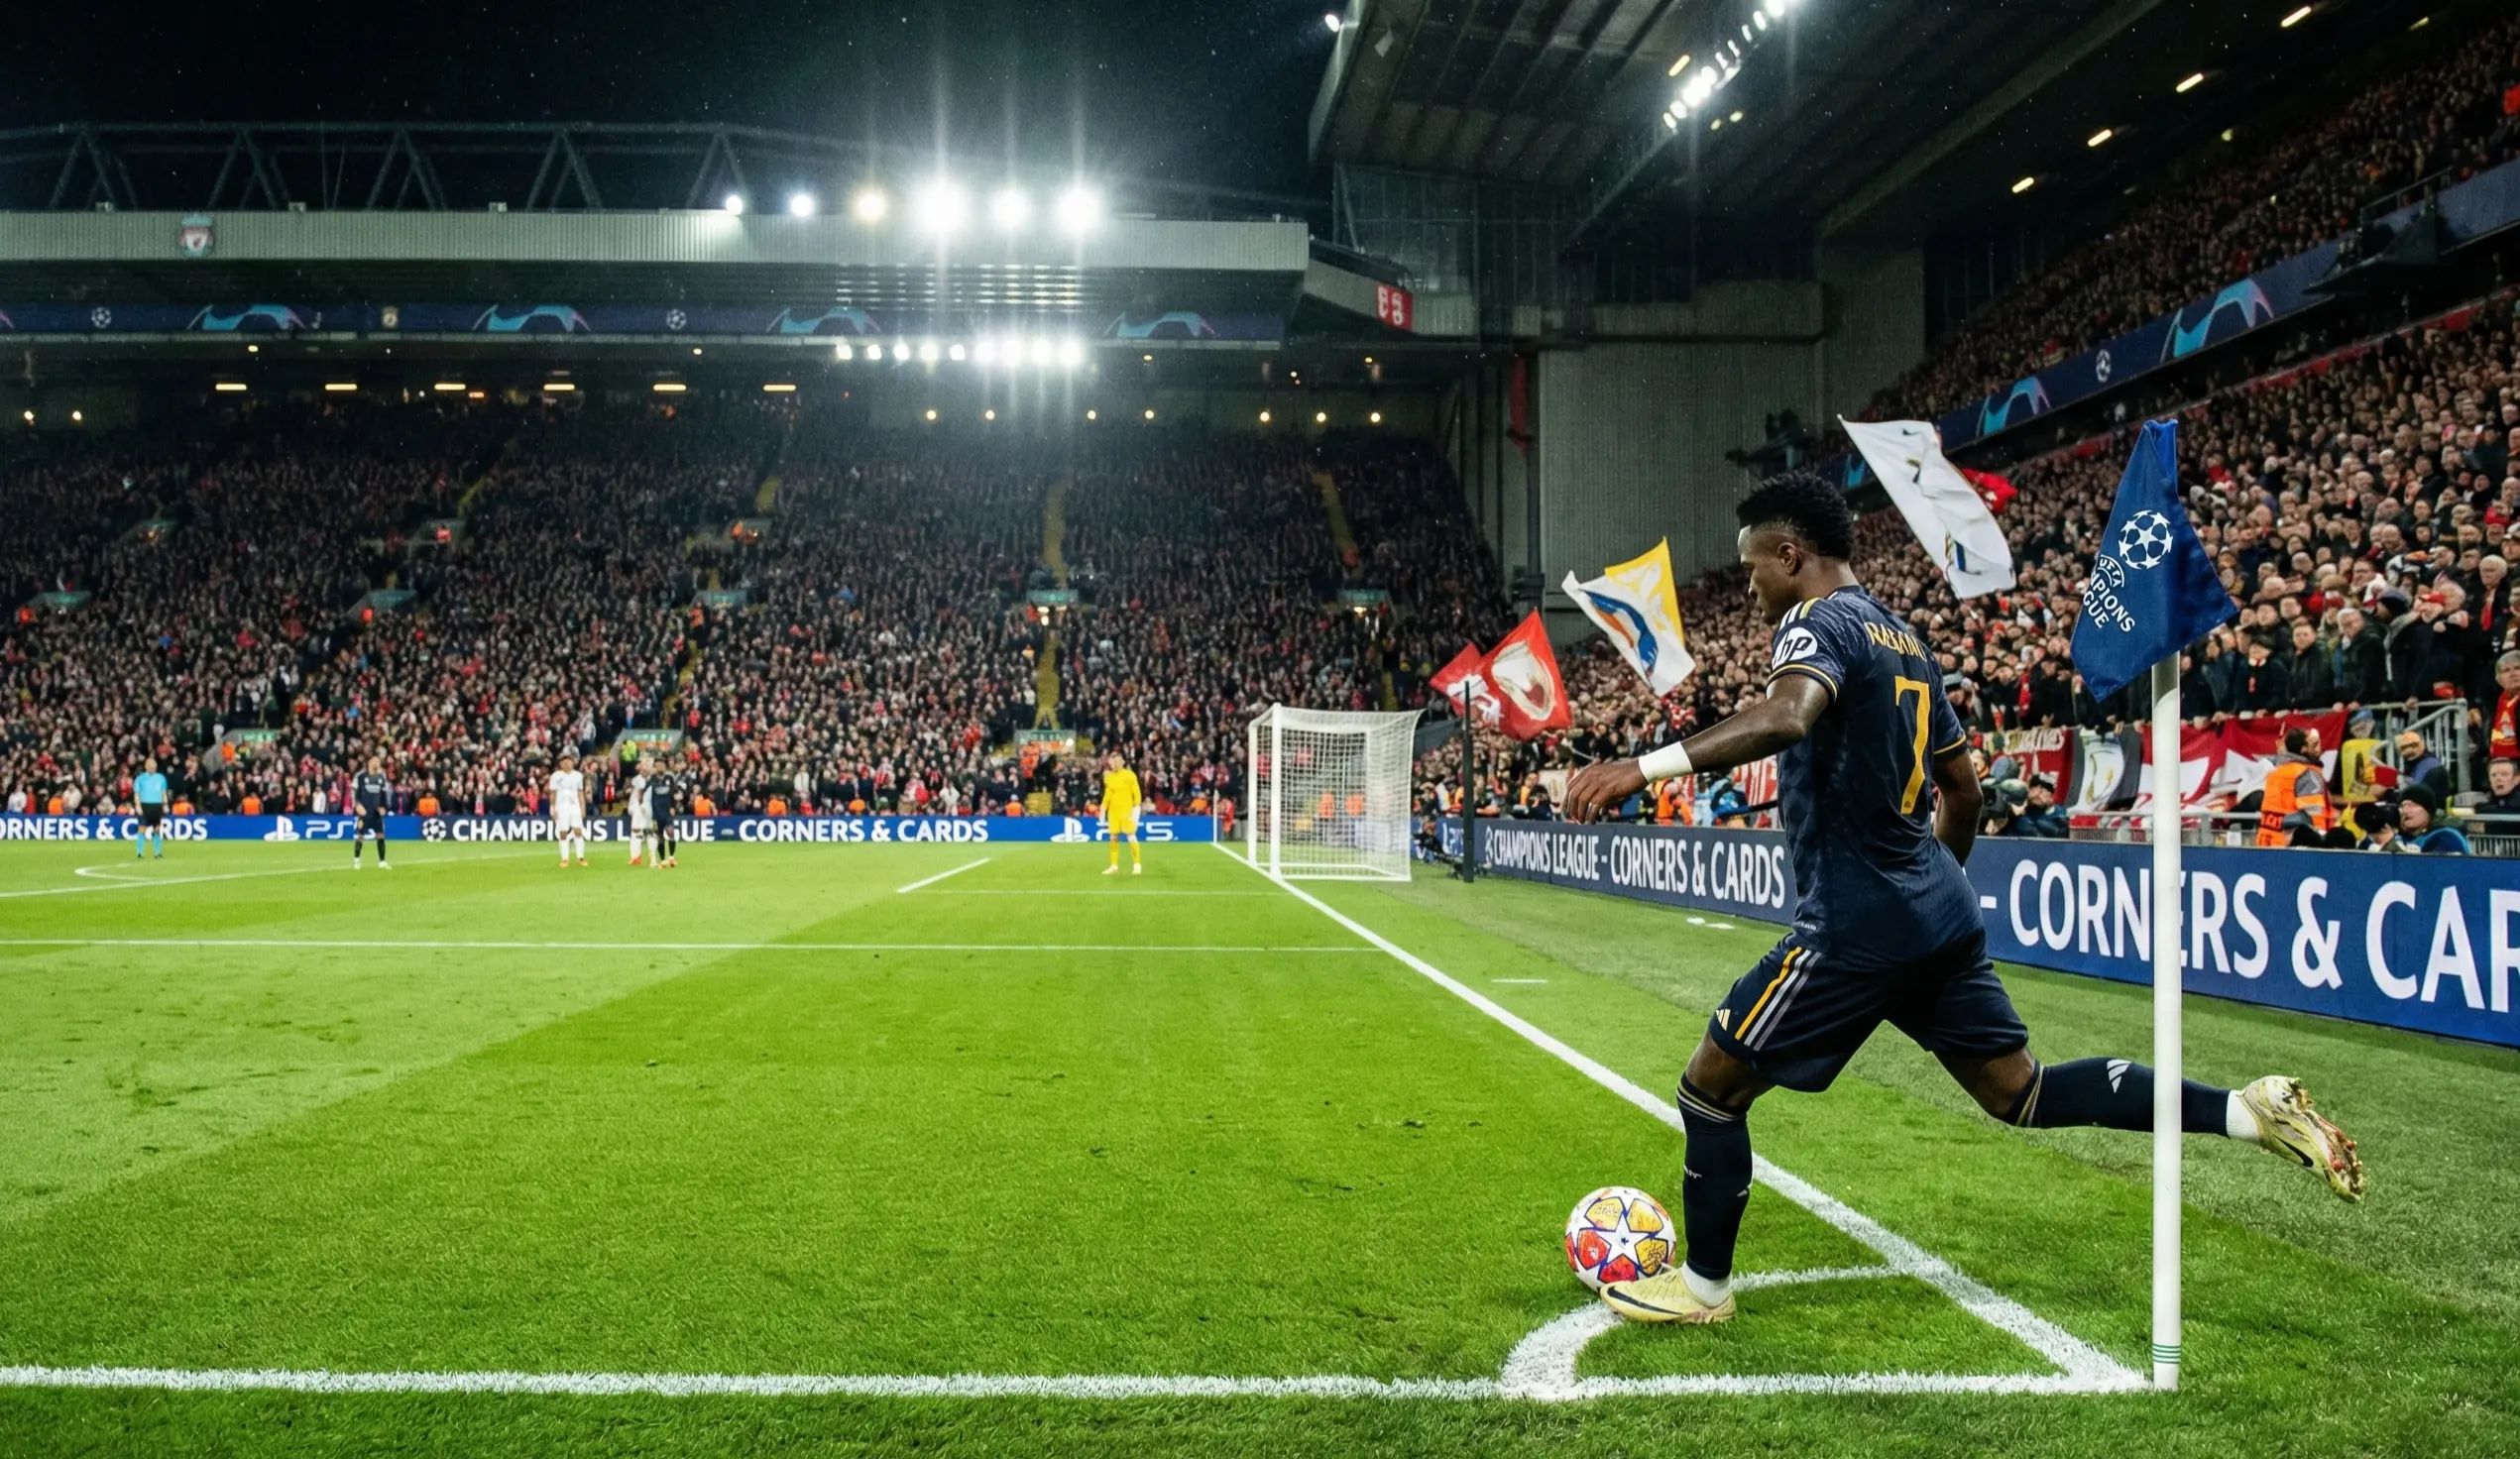
Goals grab the headlines, but some of the sharpest betting value in Champions League football hides in markets that casual fans ignore entirely. Corner kicks and booking points – the statistical byproducts of attacking pressure and physical confrontation – create betting opportunities with different drivers than goal-focused markets. Understanding what produces corners and cards, then finding matches where bookmaker lines misprice these factors, opens an analytical edge disconnected from the crowded business of predicting winners.
Understanding Corner Kick Markets
Corner betting revolves around total corners accumulated by both teams during a match. The standard line sits around 9.5 or 10.5 corners, with bettors choosing over or under. Champions League matches average approximately 9-10 corners per game, though this varies significantly based on match profile, playing styles, and game state.
Team corner totals isolate one side’s corner accumulation. A line might ask whether Barcelona wins over or under 5.5 corners regardless of what their opponent accumulates. This market rewards analysis of specific team attacking styles rather than combined match characteristics.
Corner handicaps apply spread betting principles to corner counts. If Real Madrid is favored to dominate territorially, they might be -2.5 corners, needing to win the corner count by three or more. The underdog at +2.5 can lose the corner battle by two and still cover.
Race to corners asks which team reaches a specified corner total first – usually 3, 5, or 7 corners. This market rewards understanding of early-match patterns: which teams start aggressively versus those who grow into matches.
Asian corner lines mirror Asian handicaps with quarter-increment corner lines (9.25, 9.75) that split stakes between adjacent totals. These provide graduated outcomes when corner counts land near threshold numbers.
What Drives Corner Counts?
Corners result from attacking actions that go out of play off defenders – shots blocked wide, crosses deflected behind, low passes poked away for corners. Understanding what produces these scenarios identifies matches likely to generate corner volume.
Attacking territorial dominance creates corner opportunities. Teams that spend extended periods in the final third, delivering crosses and taking shots from wide areas, naturally force more corners. Possession percentage alone doesn’t guarantee corners – a team must advance into dangerous areas and deliver final-third entries that defenders must clear.
Crossing volume correlates directly with corner accumulation. Teams whose game plans emphasize width and delivery into the box produce corners when those crosses get deflected. Narrow, central attacking teams generate fewer corners because their attacks don’t create the wide scenarios that defenders clear for corners.
Shot volume from distance also matters. Shots from outside the area frequently get blocked, and blocked shots sailing wide produce corners. Teams that pepper long-range efforts accumulate corners as a byproduct even when finishing quality is poor.
Match state influences corner patterns. Trailing teams increase attacking urgency, pushing numbers forward and forcing corners through increased territorial pressure. Matches between similarly-matched teams produce more corners than mismatches where one team dominates without allowing counterattacking pressure. Blowouts can actually produce fewer total corners than tight matches because the losing team offers minimal attacking threat.
Champions League Corner Statistics
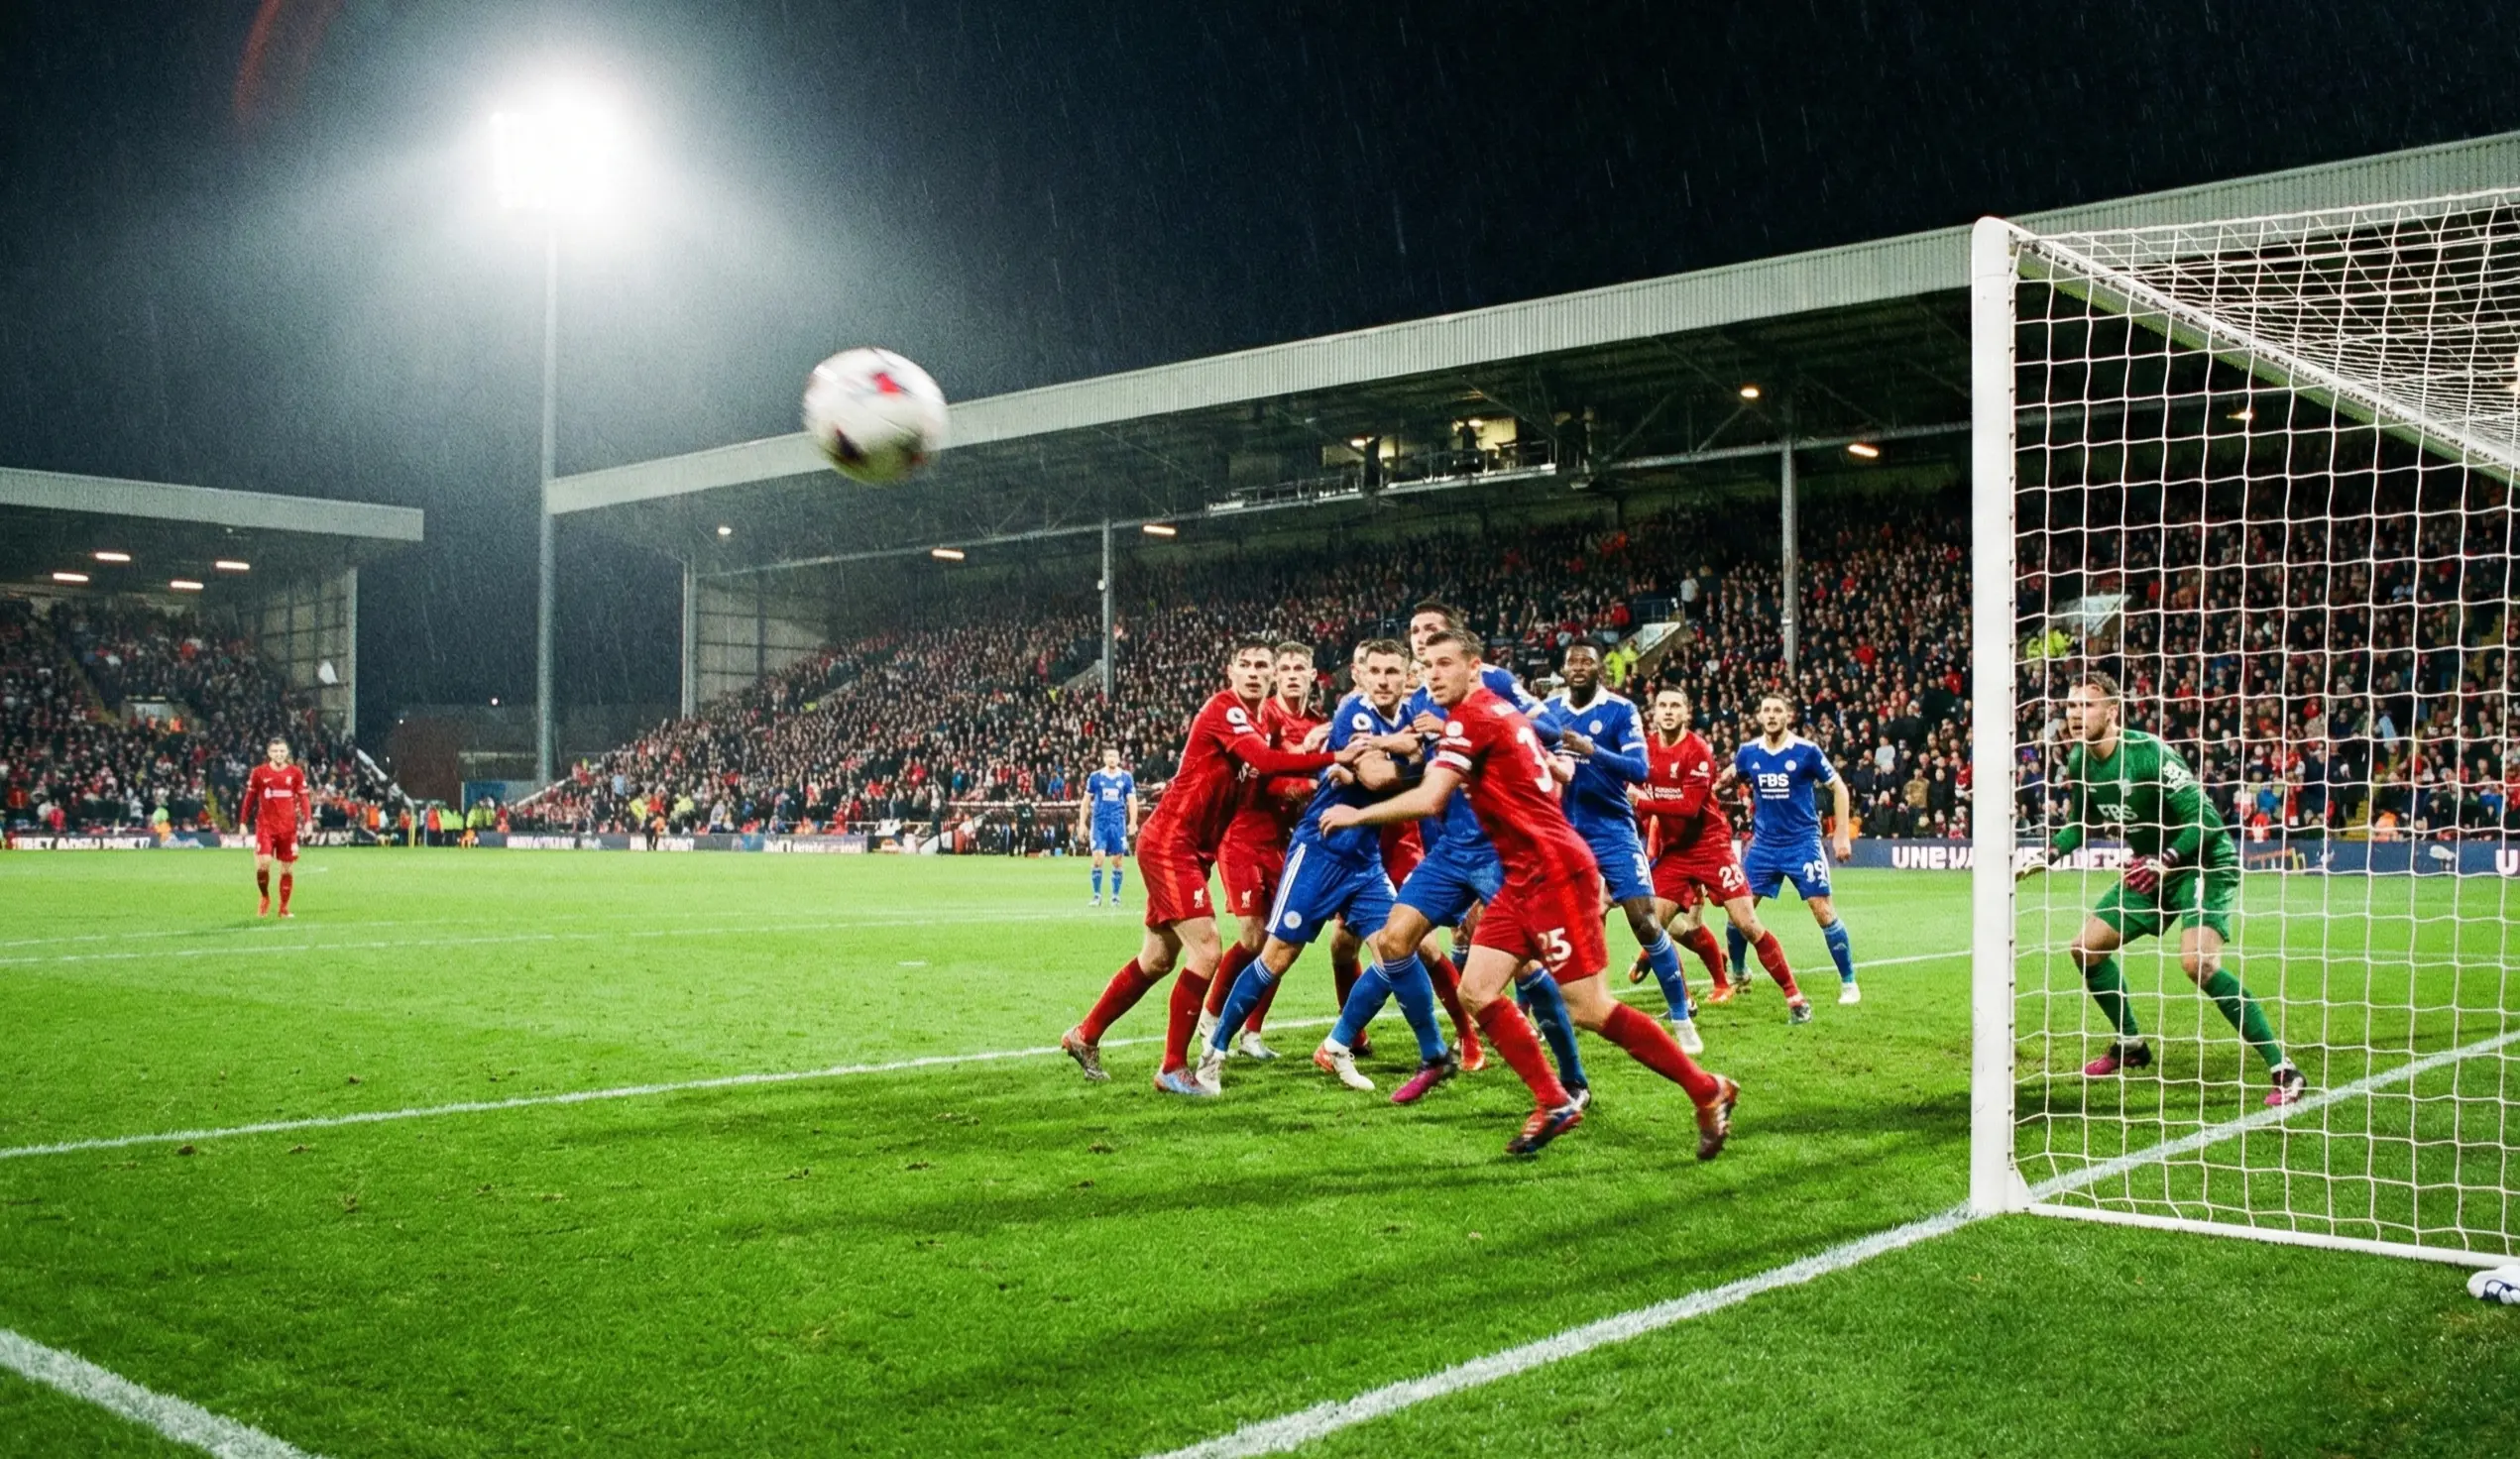
Champions League matches average around 9-10 corners per game across recent seasons, though the new league phase format introduced in 2024-25 slightly altered patterns. Matches featuring elite clubs against weaker opposition see the favorite dominate corner counts but potentially lower overall totals if the underdog barely attacks.
High-corner teams include possession-dominant sides with width in their attacking approach – Manchester City under Guardiola, Barcelona in possession phases, Bayern Munich with wide forwards cutting inside. These clubs average 5-6 corners per match through sheer territorial pressure.
Low-corner teams either play direct vertical football bypassing wide areas or sit deep defensively without forcing attacking corners when they do have possession. Counter-attacking specialists might win matches without accumulating many corners themselves.
Corner-heavy matchups occur when two attack-minded teams meet, creating open matches with territorial back-and-forth. Neither side parks the bus; both generate final-third entries. These fixtures can produce 12-15 total corners.
Corner-light matchups involve at least one defensively-oriented side that limits attacking entries. When Atletico Madrid plays their low-block style, they concede fewer corners than average because opponents struggle to penetrate areas where corner-generating blocks occur. Their own corner accumulation is also modest due to limited attacking phases.
Understanding Card Markets
Card betting centers on disciplinary points accumulated during matches. The standard market combines yellow cards (one point) and red cards (two points) into booking points totals, typically lined around 30.5 to 40.5 points depending on the fixture profile and referee assignment.
Total booking points asks whether combined cards for both teams exceed or fall below the line. A match with four yellow cards (4 points) and one red (2 points) produces 6 individual cards but only counts disciplinary points for settlement.
Team booking points isolates one side’s disciplinary record. A team expected to foul frequently might face a team line of over 17.5 booking points – requiring roughly two bookings from their players.
Player card props focus on individuals rather than teams, asking whether specific players receive yellow or red cards. These markets require player-level analysis rather than team-level patterns.
Card timing markets occasionally appear for major matches, betting on when the first card appears or whether cards occur in each half.
What Drives Card Accumulation?
Cards result from fouls, dissent, simulation, and other offenses. Predicting card counts requires understanding what produces bookable behavior.
Tactical fouling patterns create systematic card risk. Teams that press high and commit fouls to prevent counter-attacks accumulate yellows. Defensive midfielders instructed to break up play through tactical fouls receive cards as a cost of their role. Some managers explicitly accept yellow cards as acceptable trade-offs for stopping dangerous transitions.
Pace differentials generate cards when slow defenders face fast attackers. The inability to match speed legally leads to shirt pulls, clips, and professional fouls that referees book. Matches featuring speed mismatches produce more fouls and consequently more cards.
Physical intensity and rivalry context elevate card risk. Matches with historical needle – Real Madrid vs Atletico, Inter vs AC Milan – produce harder challenges and shorter tempers. Derby fixtures or elimination matches see increased physicality that referees must control through bookings.
Referee assignment dramatically influences card probability. Some Champions League officials average 5+ cards per match; others manage games with 2-3 bookings. The UEFA referee assessor assignments for knockout rounds provide information about which officials will handle specific ties, enabling card-line analysis based on historical patterns.
Analyzing Referees for Card Betting
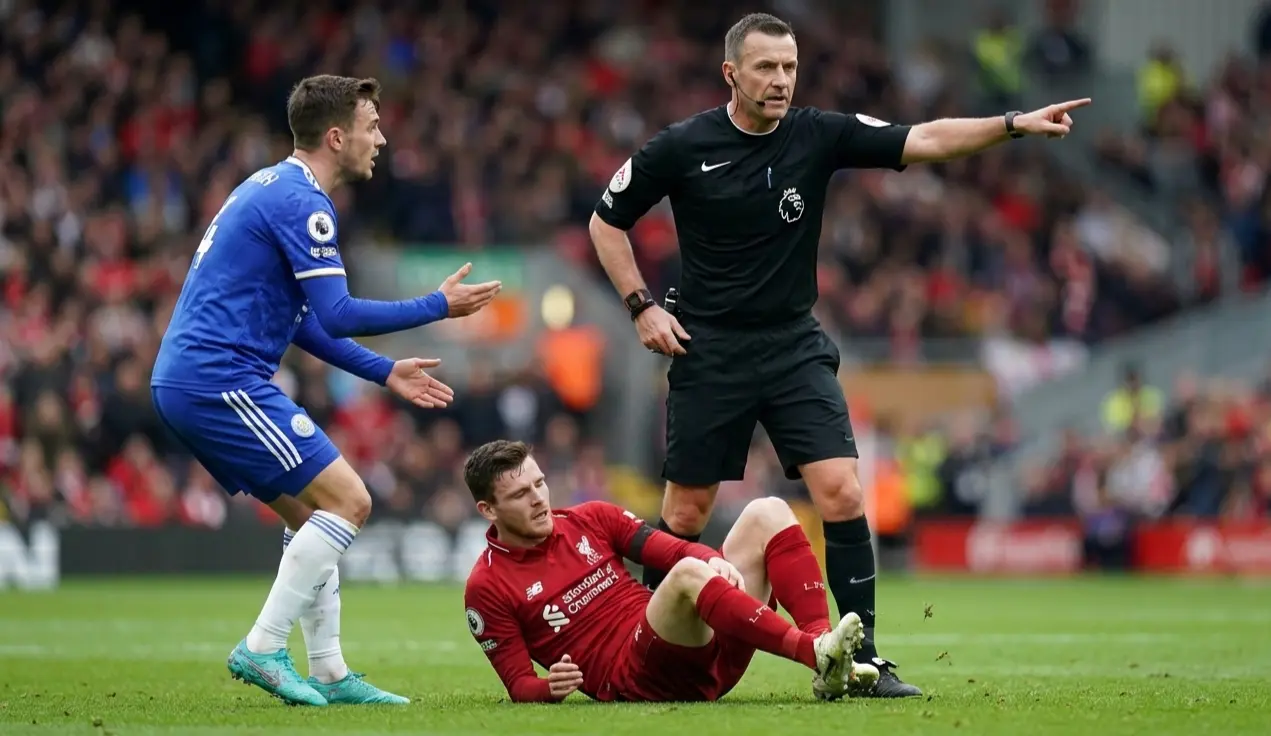
Referee research separates informed card betting from blind guessing. Elite officials working Champions League matches have extensive track records across domestic and European competitions.
Cards per game averages reveal baseline tendencies. A referee averaging 4.8 cards per match operates differently than one averaging 2.9. These averages provide starting points for evaluating whether match lines are appropriately set.
Card type distribution matters beyond totals. Some referees produce high yellow card counts but rarely show red; others reserve yellows but produce occasional reds that spike booking points. Understanding this distribution helps evaluate specific line thresholds.
Match profile interactions with referee tendencies create nuance. A card-happy referee in a physical match produces elevated totals. The same referee in a technically-skilled, low-foul contest might produce fewer cards than their average suggests. Combining referee profiles with match characteristics improves predictions.
Tournament stage adjustments affect referee behavior. Early league phase matches might see tighter officiating as referees establish authority. Knockout rounds, particularly second legs with aggregate tensions, historically produce more bookings regardless of assigned referee.
Combining Corners and Cards in Bet Builders
Same-game parlays often combine corner and card selections with other markets. Understanding correlation between these elements improves combination bet evaluation.
Corners and goals correlate positively but imperfectly. High-corner matches often produce goals because attacking pressure creates both corners and scoring chances. However, corners don’t guarantee goals – dominant teams can force many corners while failing to convert.
Cards and match outcomes show complex relationships. Underdog cards often increase when chasing matches – desperate challenges produce bookings. Favorite cards might actually decrease when leading comfortably because reduced urgency limits reckless challenges.
Corners and cards have weak correlation. A match might produce many corners through attacking play while staying disciplined, or few corners in a physical battle yielding many cards. These markets are relatively independent, making combination bets less affected by correlation adjustments.
Building bet builders with corner and card legs requires evaluating each selection independently rather than assuming one selection’s success increases another’s probability. The independence can be advantageous – you’re not betting correlated events that produce combined odds lower than mathematical multiplication suggests.
Common Corners and Cards Mistakes
Assuming team quality determines corners ignores playing style differences. The best teams don’t automatically produce the most corners – possession without width, central attacking play, or counter-attacking approaches all limit corner accumulation despite team quality.
Ignoring goalkeeper distribution overlooks corner suppression. Goalkeepers who catch or claim corners rather than parrying reduce subsequent corner accumulation. Some teams consistently produce fewer total corners because their keeper claims everything.
Betting cards without checking referee assignment is pure gambling. The same fixture might produce 35 booking points with one referee and 22 with another. Always confirm referee assignment before placing card bets.
Overreacting to recent card accumulation ignores regression. A team that received eight yellows across two matches isn’t necessarily more reckless – they might have faced unusual circumstances or card-happy officials. Base rates and underlying physical play patterns matter more than small samples.
Chasing overs after halftime assumes second-half corners match first-half rates. Actually, second halves often produce fewer corners than first halves as match pace decreases and game states stabilize. A match with 4 first-half corners isn’t automatically heading for 10 total.
Building Expertise in Alternative Markets
Corners and cards reward specialists. These markets receive less attention from casual bettors and sometimes less sophisticated line-setting from bookmakers. The opportunity for genuine edge exists for bettors willing to develop expertise beyond mainstream markets.
Track your corner and card predictions against outcomes. Build data on which match profiles produce elevated or suppressed counts. After 50 or 100 tracked matches, patterns emerge showing where your analysis adds value.
Focus on leagues and teams you know well. Understanding Barcelona’s corner patterns requires watching Barcelona regularly. Guessing about unfamiliar teams produces random results regardless of analytical framework.
Compare lines across multiple bookmakers. Corner and card lines vary more than match result odds. One book might offer over 9.5 corners at -115 while another has the same match at -105. Systematic line shopping captures significant edge.
Accept variance in these markets. A single second-half corner taken in stoppage time can swing results. A referee deciding to book or warn changes card totals. These markets have inherent noise that even excellent analysis can’t eliminate. Proper bankroll management accounts for variance through conservative stake sizing.
For an overall guide, please refer to the Both Teams to Score article for strategic insights.
For elegant naviagation, return to champions-league-bet.com.
